This is a follow up on the previous rigid image registration approach. In the following example I am showing you how to implement an affine transformation registration based on image features with python. In our lab we quite often have to analyze pharmacokinetic parameters based on transient fluorescence imaging taken from tissue in an animal skin flap window. It is the nature of tissues to move during the imaging recording process especially when heat is applied to the tissues. To correct the movement between the individual images, a affine transformation approach is presented to correct the images.
In a first step, the gradient images are derived from the original images and "landmark" features are detected via threshold criteria (Figure 1).
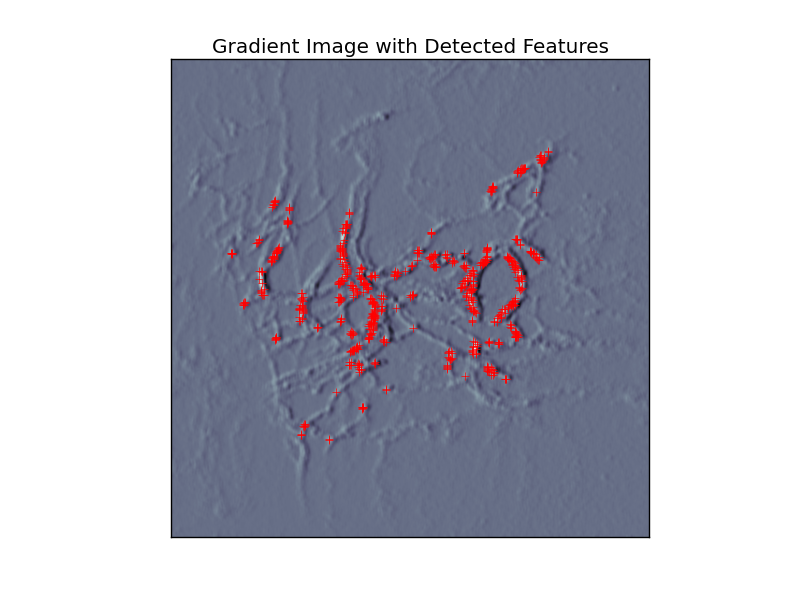 |
| Figure 1 |
In a second step, affine transformation is applied to the matching image via optimization method until a defined distance criteria (nearest neighbor criteria with KDTree) between the landmarks reached a minimum (Figure 2).
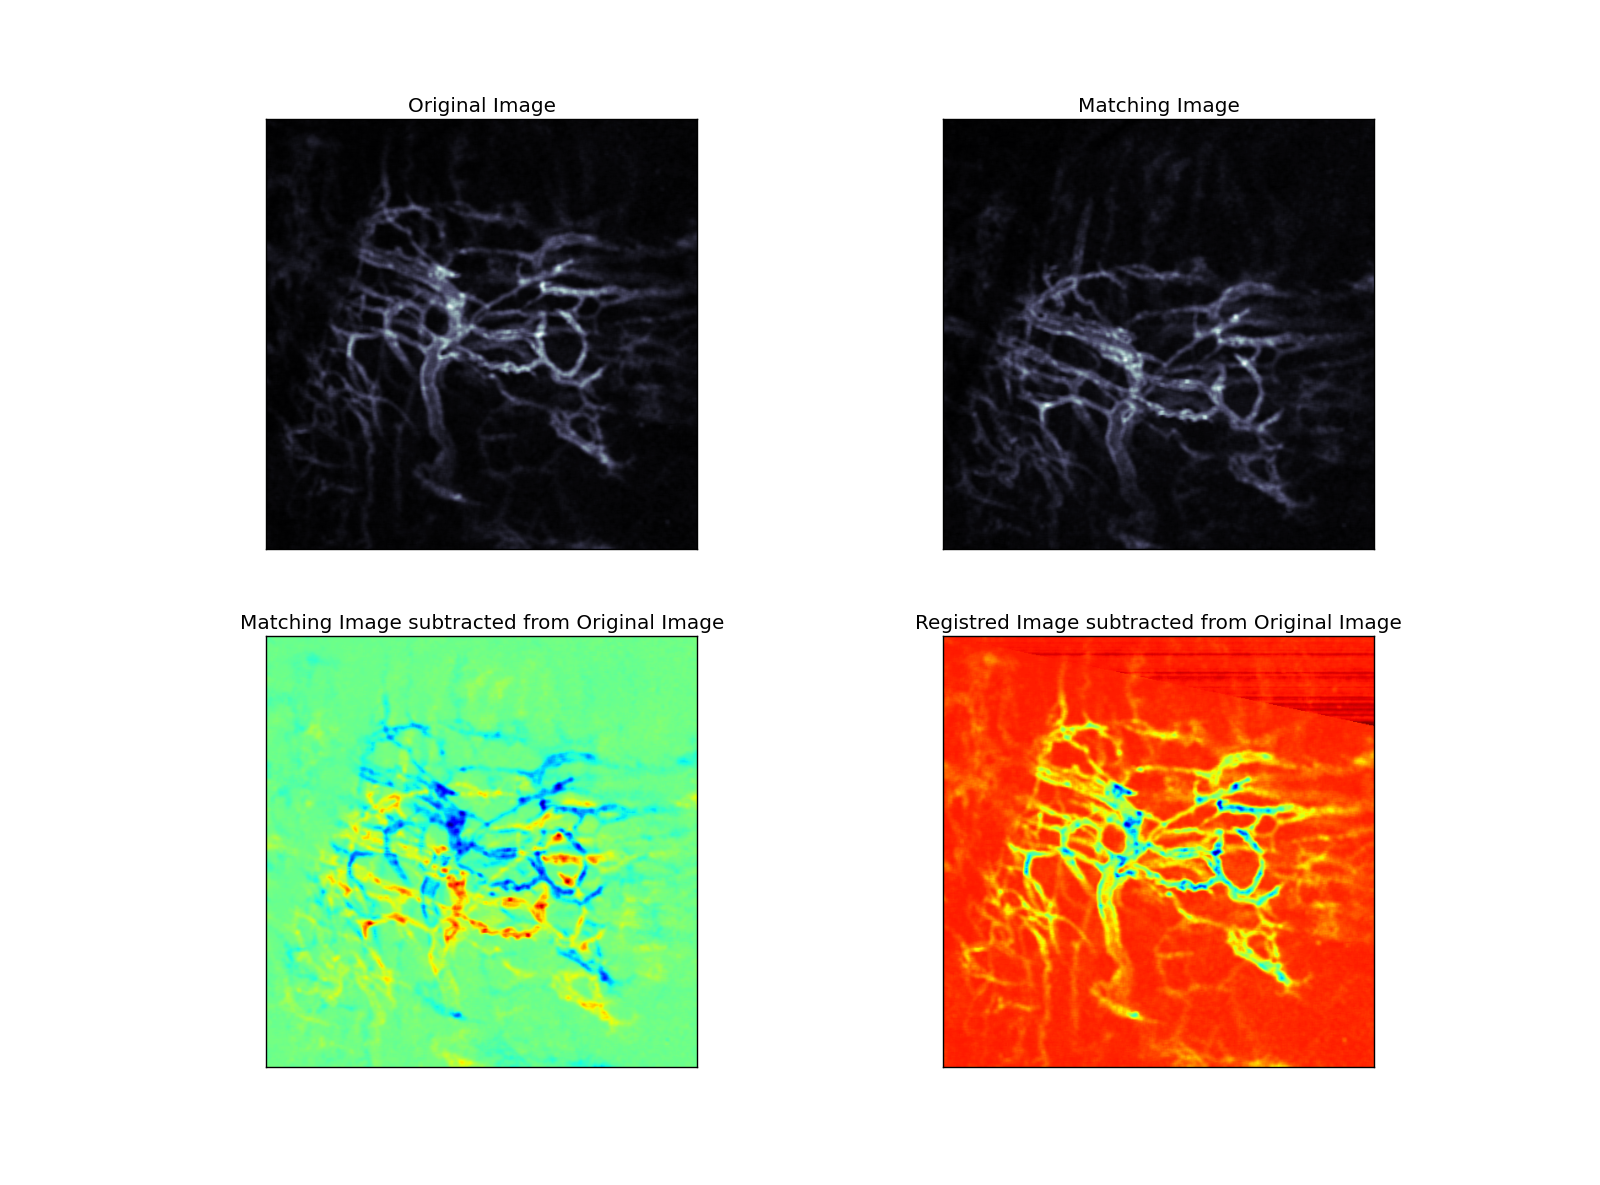 |
| Figure 2 |
The Python code:
'''
@author: Christian Rossmann, PhD
@license:  Public Domain
@blog: http://scientificcomputingco.blogspot.com/
'''

from scipy import ndimage
from scipy.spatial import cKDTree
from scipy.optimize import fmin

def register(im1,im2):

    # initialize the transformation matrix
    T = [[1.0,0.0],[0.0,1.0]]

    # extract features from first image
    edges1 = ndimage.sobel(im1)
    features1 = dstack(where(edges1.T > edges1.mean()))[0]
    kd = cKDTree(features1)

    def errfunction(T,kd=kd,im2=im2):

        # transform the image
        img = ndimage.interpolation.affine_transform(im2,T.reshape(2,2))

        # extract features from transformed image
        edges = ndimage.sobel(img)
        features = dstack(where(edges.T > edges.mean()))[0]

        dst,idx = kd.query([features])

        # measure the distances between features.
        return sum(dst**2)

    T = fmin(errfunction,T,xtol=1.e-6,ftol=1.e-6,maxfun=5000,maxiter=5000)

    return (T,ndimage.interpolation.affine_transform(im2,T.reshape(2,2)))

im1 = imread("sample_images/IMG1.png")[:,:,0]
im2 = imread("sample_images/IMG2.png")[:,:,0]

im1 = ndimage.filters.uniform_filter(im1,5)
im2 = ndimage.filters.uniform_filter(im2,5)

im1 -= im1.min(); im1 /= im1.max()
im2 -= im2.min(); im2 /= im2.max()

(T,rimg) = register(im1,im2)

#%%
figure(1)
clf()
s = subplot(1,1,1)
title('Gradient Image with Detected Features')
imshow(edges,'bone')
edges = ndimage.sobel(im1)
features = dstack(where( (edges.T > 0.45) & (edges.T < 0.55) ))[0]
plot(features[:,0],features[:,1],'+',color='red')
xlim([0,im1.shape[0]])
ylim([0,im1.shape[1]])
s.axes.get_xaxis().set_visible(False)
s.axes.get_yaxis().set_visible(False)
#%%
figure(2)
clf()

s = subplot(2,2,1)
title('Original Image')
imshow(im1,'bone')
s.axes.get_xaxis().set_visible(False)
s.axes.get_yaxis().set_visible(False)

s = subplot(2,2,2)
title('Matching Image')
imshow(im2,'bone')
s.axes.get_xaxis().set_visible(False)
s.axes.get_yaxis().set_visible(False)

s = subplot(2,2,3)
title('Matching Image subtracted from Original Image')
imshow(im2-im1,'jet')
s.axes.get_xaxis().set_visible(False)
s.axes.get_yaxis().set_visible(False)

s = subplot(2,2,4)
title('Registred Image subtracted from Original Image')
imshow(rimg-im1,'jet')
s.axes.get_xaxis().set_visible(False)
s.axes.get_yaxis().set_visible(False)

show()
